
Entering April 2026, BTC, ETH, and SOL recorded a price bounce after a few days of declines amid fluctuating Bitcoin Spot ETF inflows and escalating geopolitical tensions that also suppressed market sentiment. This article will discuss the projections of the three assets based on the analysis made by the Volubit team.
Article Summary
- BTC, ETH, and SOL are all in important technical areas. All three are holding important support with the potential for a rebound if they can hold it.
- Market Sentiment: Moving from panic to caution. The Fear & Greed Index rose from 20 to 37 in a month, which historically marks the phase where selling pressure subsides and gradual accumulation becomes visible.
- Macroeconomics: This week is the most macro-important week in Q2 2026. The simultaneous release of Core PCE, CPI, and FOMC Minutes data could create potential for high volatility within certain time brackets.
Technical Analysis of Bitcoin, Ethereum, and Solana April 6, 2026
Bitcoin (BTC)
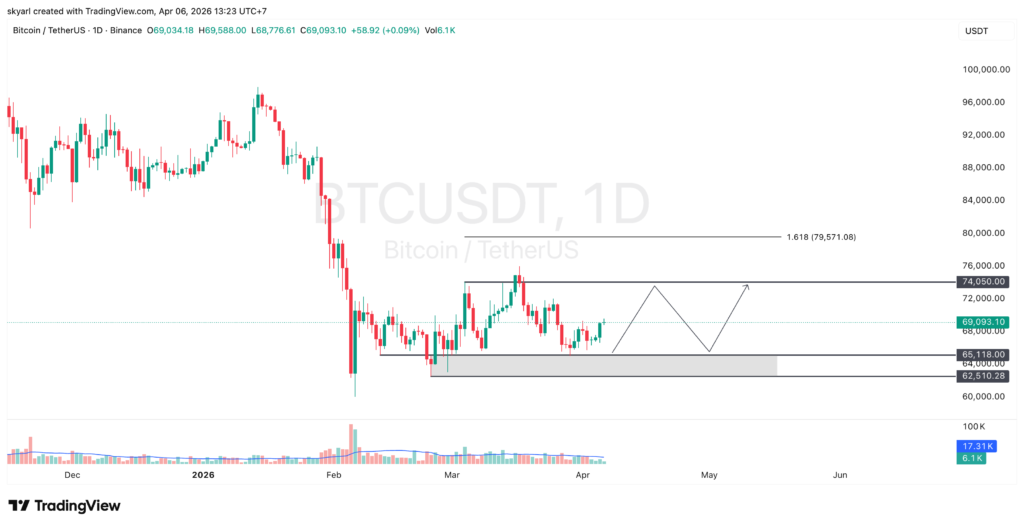
Bitcoin price movement is still in a consolidation phase, with the nearest resistance area at $74,050 and a strong support area in the range of $62,510 – $65,118. This support zone previously proved to be a solid area of demand, where buying pressure was significant enough to withstand price drops.
Towards the close of the weekly candle, Bitcoin began to show indications of a rebound after several days of moving around the support area. As a result, this indicates the potential for accumulation by market participants.
As long as the price is able to stay above the support area, the potential to continue the upward movement remains open, with the main target of retesting the resistance area at $74,050. Conversely, if there is a breakdown from the support zone, then the risk of further correction needs to be watched out for.
Ethereum (ETH)
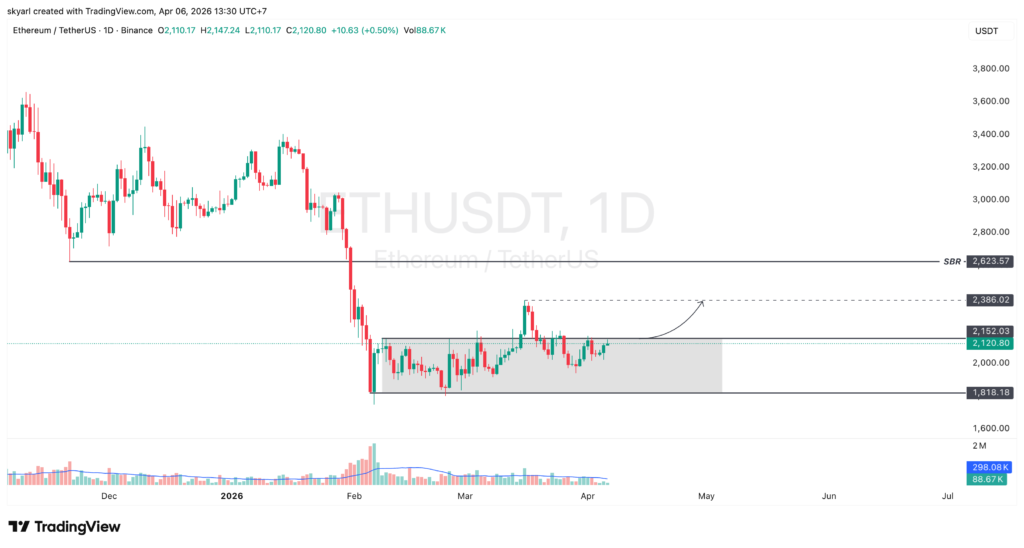
Ethereum price is currently testing the resistance area which is the upper boundary (top box) of the consolidation phase, at the level of $2,152. Notably, the price reaction at this level will be a key factor in determining the direction of the next movement.
If there is a valid breakout accompanied by increased volume, then ETH has the potential to continue its rise towards the previous high area around $2,386.
However, if there is a rejection in the resistance area, then the price has the potential to correct, with a strong support area at the level of $1,818 as the nearest downward target.
Solana (SOL)
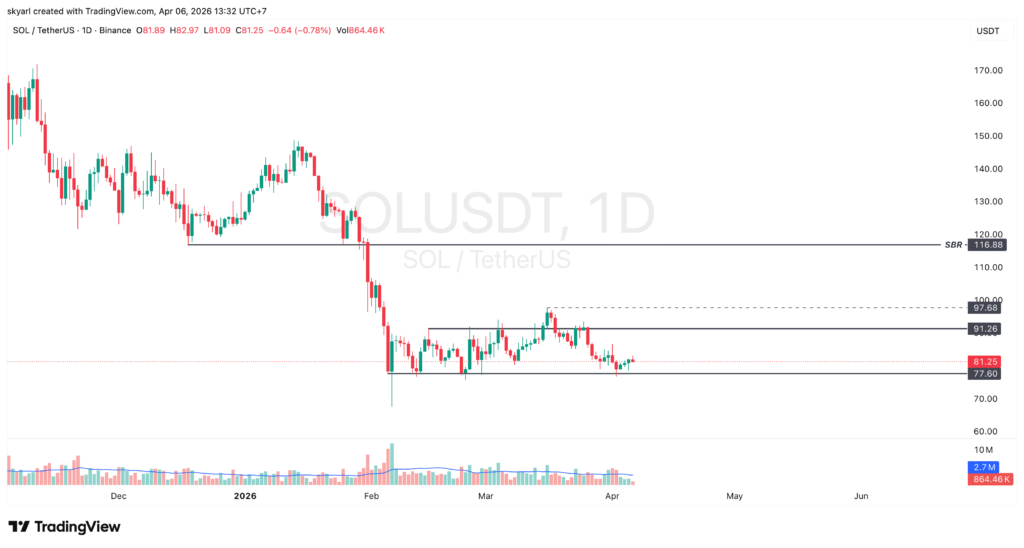
Solana’s current price movement is still around the support area at $77.60, which is a crucial zone in maintaining the short-term price structure.
Confirmation of an upward movement will be stronger if a dominant bullish candle (such as a marubozu) is formed, supported by an increase in transaction volume. This can be an indication of the entry of buying interest from market participants.
If this scenario occurs, then SOL has the potential to continue rising towards the resistance area which is the upper boundary of the consolidation, located at $91.26.
Conversely, failure to maintain the support area could open up opportunities for further weakness.
Market Sentiment: “Risk-Off” Conditions
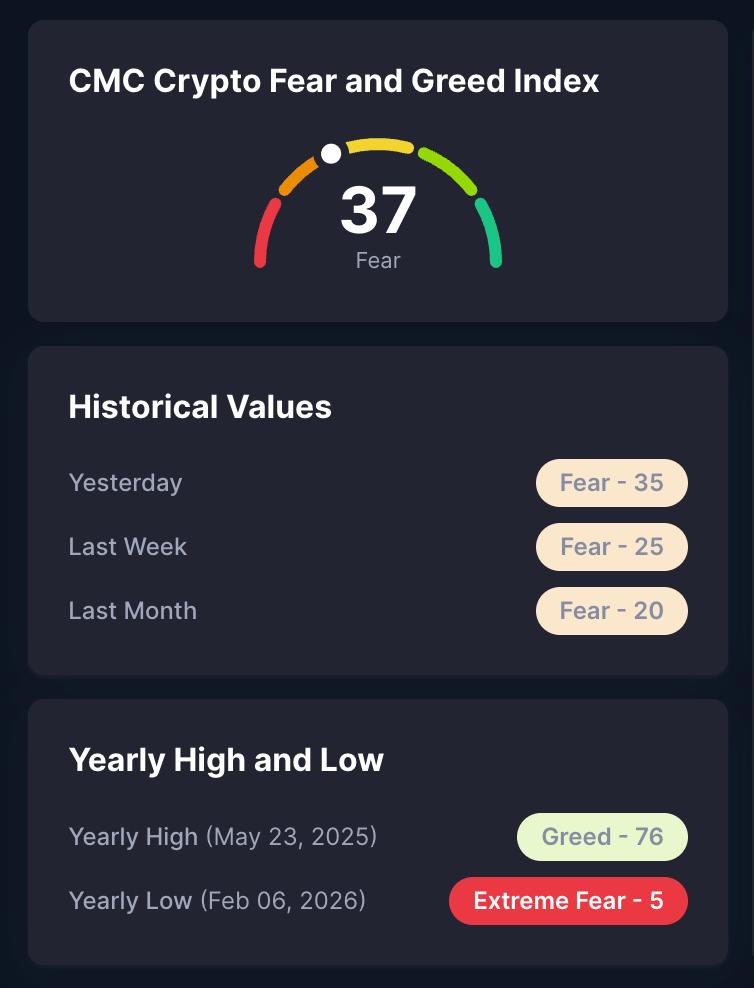
Based on data from CoinMarketCap, the Fear & Greed Index value is currently at 37 (Fear). This shows that market sentiment is still dominated by a sense of caution (risk-off), although not at extreme levels.
Historically:
- Yesterday: 35 (Fear)
- Last week: 25 (Fear)
- Last month: 20 (Fear)
Overall, there was a gradual improvement in market sentiment, from deeper fear levels to slightly more stable conditions. This, in turn, indicates that selling pressure is easing and market confidence is slowly recovering.
The crypto market sentiment is currently in an early recovery phase, not yet fully bullish but already out of panic mode. This is the usual phase:
- Become a potential gradual accumulation
- But still need technical confirmation(breakout / higher high)
Bitcoin Spot ETF Fund Flows
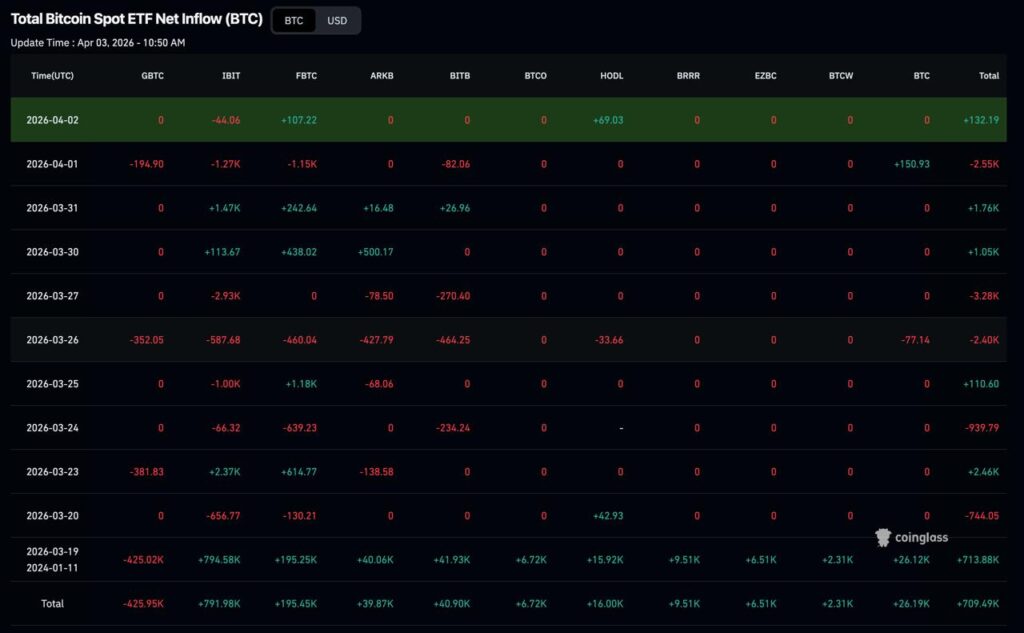
Bitcoin Spot ETF Netflow data from Coinglass shows that institutional fund flows are still experiencing high fluctuations, but there are indications of recovery in the short term.
As of the latest update (April 2, 2026), there was a net inflow of +132.19 BTC, which was driven by:
- FBTC: +107.22 BTC
- HODL: +69.03 BTC
- While IBIT recorded outflows: -44.06 BTC
This indicates that although uneven, institutional buying interest has started to return selectively.
If you look at the previous movements:
- April 1, 2026: Significant net outflow of 2.55K BTC
- March 31, 2026: Strong net inflow of +1.76K BTC
- March 30, 2026: Net inflow of +1.05K BTC
- March 27, 2026: Large net outflow of 3.28K BTC
- March 26, 2026: Net outflow of 2.40K BTC
It can be seen that fund flows move in a volatile pattern (alternating inflow-outflow), reflecting the unstable market conditions and the wait-and-see tendency of institutional investors.
Fund flows on Bitcoin Spot ETFs are currently in a transitional phase:
- From selling pressure (large outflow)
- Towards initial accumulation potential (inflow starts to appear)
However, confirmation of a stronger bullish trend will only be seen if:
- Consistent inflow for several consecutive days
- Accompanied by a significant increase in volume
This Week’s Macro Agenda
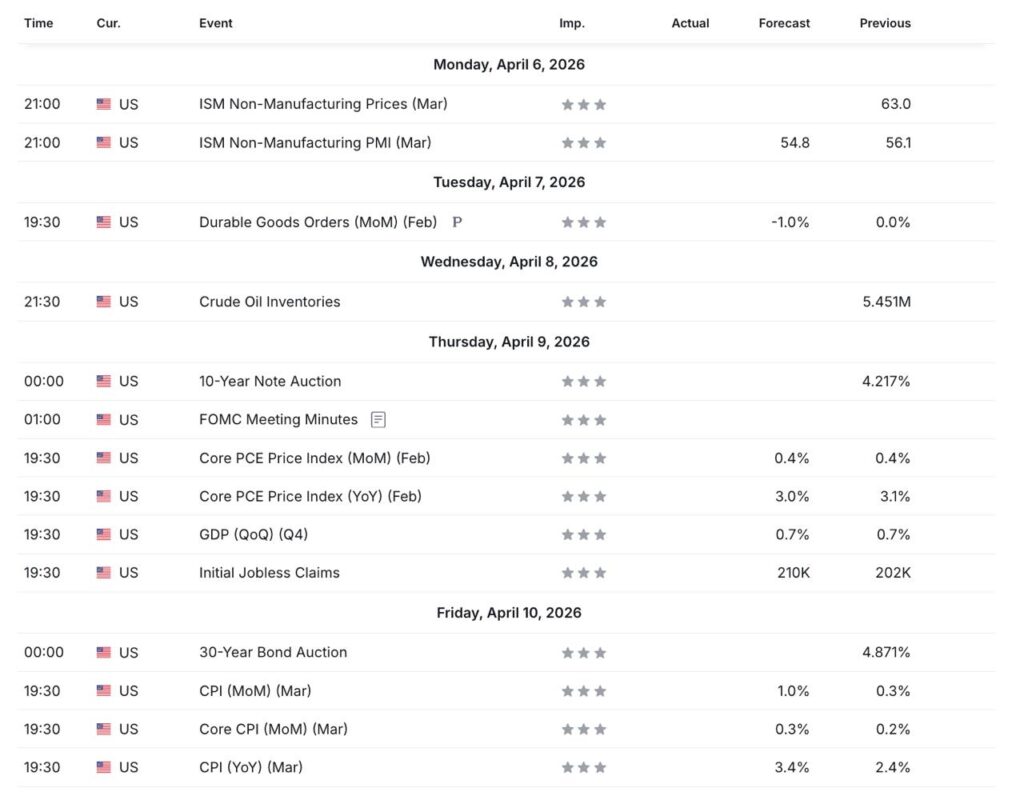
This week global markets will be heavily influenced by economic data from the United States, particularly regarding inflation and the direction of interest rate policy from the Federal Reserve.
Main focus:
- Core PCE (Thursday) → the Fed’s favorite inflation indicator
- CPI (Friday) → short-term market direction determinant
- FOMC Minutes → monetary policy guidance
Macro Interpretation:
- Inflation declines → rate cut opportunity increases → bullish crypto
- Inflation rising → policy remains tight → crypto bearish
The market is in a phase of waiting for confirmation of policy direction, so high volatility is highly likely.
Conclusion
This week’s report illustrates that the crypto market is in a transitional phase from selling pressure to early recovery. However, this price movement is not yet strong enough to be confirmed as a bullish trend. Similarly, technical analysis of BTC, ETH, and SOL all showed consolidation patterns at crucial support areas. Meanwhile, on the macro front, the market is currently in wait-and-see mode. Specifically, investors are awaiting the release of US inflation data, including Core PCE and CPI. Ultimately, these figures will determine the direction of the Fed’s interest rate policy.
Disclaimer: This article was created by Volubit. All information presented in this article is intended for educational and general informational purposes only. This content is not intended as investment advice, a recommendation, or a solicitation to buy or sell any specific crypto asset, nor should it serve as the basis for any financial decision. Any investment decision is solely the responsibility of the reader, taking into account their own financial condition, investment objectives, and risk tolerance.